

Primer on Trading Comparables - 1

Trading comparables aka “Trading Comps” is a commonly used valuation methodology utilized by investment bankers due to its relative ease of usage.
In the first of my “primer” series, I will attempt to provide a understanding of “Trading Comps” as a valuation methodology for readers from my perspective.
Commonly known as “Publicly Traded Comparable Analysis”, the valuation of any company can be derived by using the market trading multiples of comparable companies that will be used to apply on the selected key financials of the company, which we are trying to derive the valuation for.
To give a layman view, for example if we are trying to determine the valuation of a company in the business of providing software as service “SaaS” to corporate clients, we will first need to derive a list of companies that does similar business services or offerings to the Company we are attempting to value. (in our world, we term it as comparables) In deriving a list, there are other key considerations which one need to consider and I will look to explain in subsequent articles. In this explanation, I will simplify the approach, so back to our example, companies in the “SaaS” space will be like Salesforce, Zendesk etc. These companies are listed in the US stock exchange and has market trading value attached to it.
For example, Salesforce’s market cap is US$265bn and when compared to its historical sales, it is trading at 10x Price to Sales. Zendesk’s market cap is c. US$14bn and when compared to its historical sales, it is trading at c. 12x Price to Sales. The average Price to Sales of these 2 companies is c. 11x, following which we can use this multiplier to apply against the sales figure of the Company we are attempting to value. If the historical sales of the Company is US$10 million, the implied equity valuation of the Company will be c. US$110m (11x multiple by US$10 million of sales).
There are several commonly used trading comparable multiple used in comparables analysis like Price to Earnings, Price to Sales, Price to Book, Firm Value to Earnings Before Interest, Tax, Depreciation and Amortization (“EBITDA”), Firm Value to Sales etc. (the above example uses Price to Sales)
Before we do a deep dive on the the various metrics and the key considerations and differences between them, we should first have a good understanding of what is Firm Value and Equity Value as these are the key numerator used in trading comparables analysis that will be divided against financial metrics like Sales, EBITDA, Net income etc to arrive at an multiple output. (See below)

Primer: Firm Value versus Equity Value
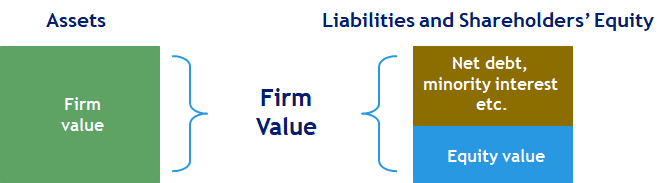
Firm value (also typically known as Enterprise value), in essence, is the market value of all the capital employed or invested in a business. From an accounting standpoint, you can refer Firm value to total assets found in the balance sheet of the financial statements which is also a summation of shareholder equity and total liabilities though it will not be entirely like for like since financial statements are governed by accounting standards and principles.
Firm value = Equity value + Total debt less Cash balances in the Company (also known as “Net Debt”) + Minority interest and other form of capital, for example preference shares, that is used to employ or invest in the business.
(Minority interest denotes any equity interest in the business that are not fully owned by Company’s owners, for example if a company owns 70% of a business under the group. 30% of that business will be considered minority interest and will form part of Firm value computation)
Equity value, in essence, will be equal to market capitalization for public listed companies which is derived by using share price per share multiply by total shares outstanding or for private companies, the equity invested by shareholders of the Company. From an accounting standpoint, this can be referred to shareholder’s equity under the balance sheet of the financial statements. Again, this will not be entirely like for like for reasons referred above.
I wanted to set the stage to highlight the difference between equity value and firm value upfront as when performing trading comparable analysis, some financial metric will be relevant to equity value whereas some will be relevant to firm value when computing the multiple output.
For example:
Net income will be used as a denominator to Equity value, since net income represents net earnings to shareholders after paying the interest expense for any debt employed in the business.
EBITDA will be used as a denominator to Firm value, since EBITDA represents earnings available to all providers of capital which includes shareholders and debt holders.

Stay tuned on next article where we drill down to the different commonly used multiples and the considerations in adapting them in trading comparables analysis.
Have reading and have a good weekend ahead!