Primer on Trading Comparables - 2
Earlier on, I shared a quick synopsis primer on Trading Comparables and ended the article on highlighting the difference between Firm Value (also known as Enterprise Value) and Equity Value and the relevant metrics that will be appropriate to them respectively.
In today’s article, I will go through the commonly used trading comparables multiple used and what are key advantages and considerations in utilizing one versus the other.
There are 4 commonly used multiple used in trading comparable analysis which i will go through one by one:
Price/Earnings (“P/E”)
Price/Earnings to Growth (“PEG”)
Firm Value / Sales (“FV/Sales”)
Firm Value / EBITDA (“FV/EBITDA”)
1 - Price/Earnings (“P/E”)
P/E is the most used comparable metric due to ease of computation. Net income is also easily available:
Historical net income can be found in the audited financials of Company and is an accounting line item.
Projected net earnings is predominantly reference by research analyst hence, making it widely available for the market to use.
Notwithstanding the above, there are certain key considerations to take note, when using P/E:
P/E does not consider the leverage undertaken by the company.
For example, for 2 similar companies, if one uses debt to fund 80% of the total capital to invest the business versus one who utilize only 20% of debt. The P/E ratios of these 2 companies could be vastly different and may not be deemed to be apple to apple comparison due to the risk profile and if their business sector is seasonal and cyclical.
2 - Price/Earnings to Growth (“PEG”)
PEG is one of my favorite ratios that I used to analyze alongside P/E ratios for Comparables.
PEG is intuitive as it allows comparison of similar companies who may have varying growth profile which is a key driver of why Investors / Market attribute a certain P/E ratio to one versus the other.
Take Salesforce and Zendesk in our previous example, Salesforce’s Forward P/E is 70x and Zendesk’s Forward P/E is 145x - looks drastically different right? but, if we look at the long-term earnings growth, Salesforce is anticipating 20%, while Zendesk is anticipating 40% long-term earnings growth. We can see Zendesk is projecting a c. 2x growth versus Salesforce. (Source: Bloomberg)
In computing the multiple on a PEG basis (P/E divide by Earning Growth), Salesforce’s PEG multiple becomes 3.5x while Zendesk’ PEG multiple becomes 3.6x. Here, in comparison of both PEG, the multiple will look more reasonable and intuitive given the 2x earnings growth Zendesk is anticipating versus Salesforce.
Key considerations to note will be similar to P/E as net earnings is the key financial metric used in the computation.
3 - Firm Value/Sales (“FV/Sales”)
FV/Sales is a commonly used metric adapt by today’s new economy and technology companies where the key focus is on the ability of such companies to generate strong revenue growth going forward.
Hence FV/Sales commonly used in companies that are in the high growth business sector, think Amazon and Google for example.
Notwithstanding the growing focus in this multiple given today’s new economy focus, this ratio does not take into account the profitability, which in today’s context, investors are also focusing on the roadmap to profitability on top of the revenue growth.
4 - Firm Value/EBITDA (“FV/EBITDA”)
Finally, we come to FV/EBITDA, which is another commonly used metric alongside P/E ratio used in comparable analysis.
Typically used as a proxy for cash earnings1 valuation metric that is attributable to all providers of capital in a business (both debt and equity).
FV/EBITDA allows comparison of companies with different leverage and capital structure (the mix of debt versus equity used to fund a business) as compared to P/E. (See above on P/E’s leverage consideration)
One primary consideration to note, as EBITDA is not considered to be an accounting financial line item, there could be different adjustments made to the EBITDA calculation which could varied across companies, that may not make it apple to apple comparison.
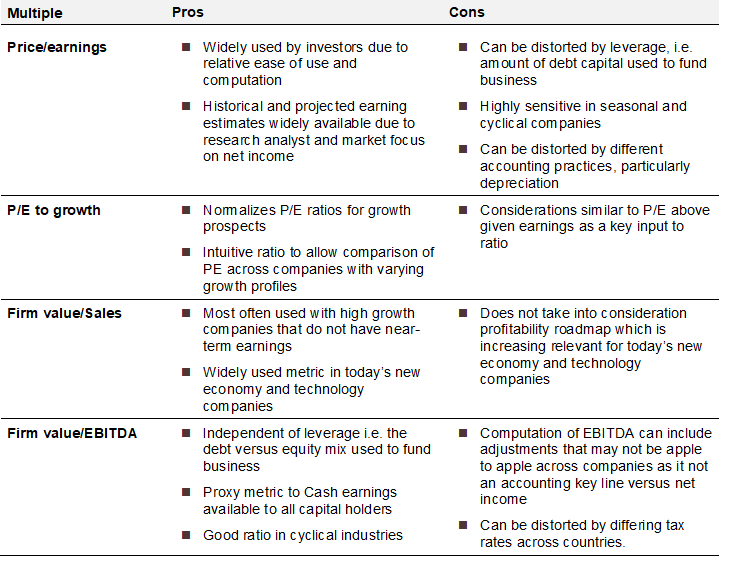
Below is a summarized table on the pros and cons of the commonly used multiple metric I have described above for your easy reference.
To conclude today’s article:
We have observed the advantages and key considerations of the various commonly used comparable metric.
Here, I will advocate using a combination of the above multiple metrics when one undertakes trading comparable analysis to determine a Company valuation due to certain key advantages and considerations tied to each metric.
There will never be a “one multiple fits all metric” in trading comparable analysis.
Utilizing a combination of multiples will help us better understand why certain companies trades at certain multiples and will seek to guide us in determining the right and relevant combination of multiples we can used when determining the valuation of the Company using Trading Comparable analysis.
Happy reading and have a good weekend!
EBITDA is defined as Earnings Before Interest, Tax, Depreciation and Amortization. Typically used as a quick proxy to cash earnings multiple as Depreciation and Amortization expenses are considered non-cash.


